CHAPTER 2 · ADME

Section 1

Half-Life and Clearance

The fundamental pharmacokinetic relationship and its clinical interpretation

Half-life and clearance are the two most clinically applied pharmacokinetic parameters. Together with volume of distribution — the third fundamental parameter introduced in Module 2 — they determine how often a drug must be dosed, how long it takes to reach steady state, and how changes in organ function alter drug behavior in the body.

The Half-Life Formula and What It Means

The elimination half-life (t½) is the time required for the plasma concentration of a drug to fall by 50 percent. For drugs that follow first-order kinetics — where the rate of elimination is proportional to the drug concentration — the half-life is constant regardless of the starting concentration. The mathematical relationship governing half-life is: t½ = (0.693 × Vd) / CL, where Vd is the volume of distribution and CL is the total body clearance.

This equation has several important clinical interpretations. Half-life is not simply a measure of how fast a drug is eliminated — it is a composite parameter that reflects both how large the distribution space is (Vd) and how efficiently the eliminating organs remove drug from plasma (CL). A drug with a large Vd will have a long half-life even if its clearance is normal, because the large tissue reservoir slowly releases drug back into plasma. Conversely, a drug with a small Vd may have a short half-life even with modest clearance. When a patient's renal function declines, CL falls and t½ prolongs proportionally, but Vd may be unchanged or may itself change depending on the patient's fluid status and protein binding.

The 5 Half-Lives Rule

After each half-life, 50 percent of the remaining drug is eliminated. The cumulative elimination at successive half-lives is 50 percent, 75 percent, 87.5 percent, 93.75 percent, and 96.875 percent. By five half-lives, approximately 97 percent of a single dose has been eliminated, which is considered effectively complete for practical purposes. This 5 half-lives rule applies symmetrically: just as it takes 5 half-lives to eliminate a drug, it also takes 5 half-lives to reach steady state during repeated dosing.

The clinical implications are direct. A drug with a half-life of 6 hours reaches steady state in approximately 30 hours (5 × 6 hours). A drug with a half-life of 4 days (digoxin, half-life approximately 36 to 48 hours) takes approximately 7 to 10 days of maintenance dosing to reach steady state. A drug with a half-life of weeks (amiodarone) may take months of continuous dosing to reach steady state. This prediction of time-to-steady-state is entirely determined by the half-life — the dose size and dosing frequency affect the steady-state concentration level but not the time to reach it.

Clearance as the Primary Determinant of Steady-State Concentration

At steady state, the rate of drug input equals the rate of drug elimination. This means that the average steady-state plasma concentration is determined entirely by the dose rate (dose divided by dosing interval) and the clearance: average steady-state concentration equals dose rate divided by clearance. Clearance is therefore the pharmacokinetic parameter that determines how much drug accumulates in the body at a given dose rate. Volume of distribution affects the half-life and the time to reach steady state, but has no effect on the steady-state concentration itself. This distinction is clinically important: if a patient has a low clearance (renal or hepatic impairment), the steady-state concentration will be higher for the same dose rate — and the dose must be reduced to prevent toxicity. If a patient has an increased volume of distribution (edema, obesity), the time to reach steady state will be longer, but the same maintenance dose will ultimately produce the same average concentration once steady state is achieved.

Half-Life and Clearance — Clinical Summary

t½ = (0.693 × Vd) / CL. Large Vd → long t½. Reduced CL → long t½. Steady state reached in ~5 half-lives regardless of dose or frequency. Dose controls steady-state concentration level; only CL determines average steady-state concentration. Vd controls time to steady state and loading dose, not steady-state level. In renal or hepatic impairment: CL falls → t½ prolongs → reduce dose or extend interval.


Section 2

Steady State

Accumulation to steady state, loading doses, and the relationship between dosing interval and concentration fluctuation

Steady state is the pharmacokinetic condition in which the plasma drug concentration fluctuates between a consistent peak and trough over each dosing interval, because the amount of drug eliminated per dosing interval exactly equals the amount of drug administered. Understanding how to achieve steady state promptly and how dosing interval affects the concentration-time profile has direct implications for how clinicians initiate and adjust drug therapy.

Why Concentration Rises to Steady State

When a drug is given repeatedly at fixed intervals, each new dose is added to the remaining drug from previous doses. As plasma concentration rises, the rate of elimination increases (because elimination rate is proportional to concentration for first-order drugs), until eventually the amount eliminated per dosing interval exactly equals the dose administered. At this equilibrium — steady state — peak and trough concentrations remain constant from dose to dose.

The critical practical point is that changing the dose or dosing frequency does not change the time required to reach steady state — it only changes the concentration level at which steady state is reached. A double dose reaches the same steady state in the same time as a single dose; it simply reaches a higher steady-state level. For drugs with long half-lives, this can create dangerous misunderstandings: a clinician who doubles the dose of phenobarbital hoping to reach steady state sooner will instead reach double the intended steady-state concentration and risk toxicity.

Loading Doses

When the time to reach steady state is clinically unacceptable — because the half-life is too long to wait 5 half-lives — a loading dose can be used to achieve the desired plasma concentration immediately. The loading dose is calculated as the target concentration multiplied by the volume of distribution (as discussed in Module 2). After the loading dose, maintenance doses are given at the normal rate to maintain the achieved concentration.

Digoxin is the paradigmatic clinical example: its half-life of approximately 36 to 48 hours means that waiting for steady state would take 7 to 10 days, which is unacceptable in atrial fibrillation with rapid ventricular rate. Multiple intravenous loading doses ("digitalization") rapidly fill the large tissue reservoir and achieve therapeutic plasma concentrations, after which oral maintenance therapy maintains the level. Vancomycin loading doses in septic patients with rapidly evolving infections similarly exploit this principle to achieve therapeutic concentrations in the first hours of treatment. Phenytoin can be loaded intravenously or with fosphenytoin to rapidly achieve anticonvulsant levels in status epilepticus.

Dosing Interval and Concentration Fluctuation

When a drug is dosed at an interval much shorter than its half-life (for example, a continuous intravenous infusion, or oral dosing every 4 hours for a drug with a 24-hour half-life), the concentration rises smoothly toward steady state with minimal fluctuation between doses. When a drug is dosed at an interval much longer than its half-life, large peak-to-trough swings occur — the concentration rises steeply after each dose and falls substantially before the next, creating significant fluctuation. This fluctuation is undesirable when it causes peak toxicity or allows trough concentrations to fall below the minimum effective concentration.

Extended-release formulations exploit this principle by slowing drug release, effectively converting a high-fluctuation oral regimen to a lower-fluctuation profile. The principle also underlies once-daily aminoglycoside dosing: by giving the full 24-hour dose at once, a high peak (above the minimum inhibitory concentration, achieving concentration-dependent bactericidal killing) is followed by a trough that falls to nearly zero (allowing renal tubular cells to recover and reducing nephrotoxicity). This is the opposite of what one might expect — widening the interval reduces a toxicity problem.


Section 3

Nonlinear Pharmacokinetics

When elimination capacity is saturated and small dose changes produce large concentration changes

Most drugs follow first-order (linear) kinetics: a constant fraction of drug is eliminated per unit time, the half-life is constant, and doubling the dose doubles the steady-state concentration. A small but clinically important group of drugs follows nonlinear (capacity-limited) kinetics, in which the elimination process becomes saturated at therapeutic or supratherapeutic concentrations, producing dangerous and unpredictable concentration-dose relationships.

Michaelis-Menten Kinetics and Capacity-Limited Elimination

Nonlinear pharmacokinetics arise when the enzymatic or transport system responsible for a drug's elimination becomes saturated. At low drug concentrations, the elimination system has spare capacity and behaves as if it were first-order: a constant fraction of drug is cleared per unit time, the half-life is constant, and concentration falls exponentially. As concentration rises toward the maximum rate at which the elimination system can operate (designated Vmax in the Michaelis-Menten model), the fractional clearance decreases — a smaller and smaller fraction of the drug present is eliminated per unit time. At concentrations far exceeding the elimination system's capacity, the system operates at its maximum rate regardless of concentration: a constant amount (not fraction) is eliminated per unit time, producing zero-order kinetics, where the half-life increases as concentration rises.

The consequence for clinical dosing is severe: in the Michaelis-Menten region, a small increase in dose produces a disproportionately large increase in steady-state plasma concentration. For a drug operating near saturation, an increase in daily dose of 10 percent may produce a 50 to 100 percent increase in steady-state concentration — a relationship that makes precise dose titration extremely difficult and toxicity easy to precipitate.

Phenytoin — The Paradigmatic Nonlinear Drug

Phenytoin is the most clinically important example of Michaelis-Menten pharmacokinetics. It undergoes hepatic hydroxylation by cytochrome P450 2C9 and cytochrome P450 2C19, and the hydroxylation pathway becomes saturated near the lower end of the therapeutic range. For most patients, the Michaelis-Menten capacity (Km) for phenytoin hydroxylation is in the range of 5 to 10 micrograms per milliliter — squarely within the therapeutic range of 10 to 20 micrograms per milliliter. This means that patients being dose-titrated through the therapeutic range are operating in the nonlinear region where small dose changes produce large concentration changes.

The practical implication is that phenytoin doses should be titrated in small increments near the therapeutic range — typically increases of 25 to 50 milligrams per day — and that 4 to 6 weeks may be needed to achieve a new steady state because the effective half-life prolongs substantially as concentration rises. A patient whose phenytoin level is 15 micrograms per milliliter and who needs it at 18 micrograms per milliliter requires a very small dose increase; the same patient given the same incremental increase that would be appropriate for a linear drug could easily end up toxic at 35 micrograms per milliliter. Concurrent cytochrome P450 2C9 inhibitors (fluconazole, amiodarone) further displace phenytoin toward higher concentrations by reducing the already-limited elimination capacity.

Other Clinically Important Nonlinear Drugs

Ethanol follows zero-order kinetics at typical drinking concentrations because alcohol dehydrogenase is saturated. The liver metabolizes approximately 7 to 10 grams of ethanol per hour in a typical adult regardless of blood alcohol concentration, which is why there is no way to accelerate sobriety — the elimination rate is fixed. Aspirin at anti-inflammatory doses (greater than approximately 1,000 milligrams per day) saturates sulfotransferase-mediated metabolism, shifting to zero-order kinetics and causing salicylate to accumulate disproportionately with dose increases — a pharmacokinetic fact that contributes to aspirin toxicity at high therapeutic doses. Fluorouracil and several other antineoplastic drugs also exhibit dose-dependent kinetics within therapeutic ranges used in oncology.

Nonlinear Pharmacokinetics — Clinical Danger Points

Phenytoin: small dose increments in therapeutic range produce disproportionate level rises — increase by 25–50 mg/day near target range, not 100 mg/day. Effective half-life increases as concentration rises — wait 4–6 weeks after dose change before concluding levels are stable. Cytochrome P450 2C9 inhibitors (fluconazole, amiodarone) can precipitate toxicity by reducing already-limited metabolism. Ethanol: zero-order kinetics at all typical drinking concentrations — ~10 g/hour eliminated regardless of blood alcohol level. Salicylate toxicity: saturation of sulfation at high aspirin doses causes disproportionate accumulation.


Section 4

Therapeutic Drug Monitoring

Which drugs benefit, when to sample, and how to interpret drug levels in clinical context

Therapeutic drug monitoring is the practice of measuring drug concentrations in plasma to guide dosing, with the goal of achieving concentrations within a defined therapeutic range — high enough for efficacy and low enough to avoid toxicity. Not all drugs warrant routine monitoring; the practice is most valuable for a specific set of drugs with identifiable characteristics.

Which Drugs Benefit from Therapeutic Drug Monitoring

Therapeutic drug monitoring is appropriate when four conditions are simultaneously met: the drug has a narrow therapeutic index (the difference between effective and toxic concentrations is small); there is a measurable correlation between plasma concentration and pharmacological effect or toxicity; there is substantial inter-patient variability in pharmacokinetics (so that the same dose produces widely different concentrations in different patients); and the clinical response is difficult to assess directly. Drugs that meet these criteria include aminoglycoside antibiotics, vancomycin, phenytoin, phenobarbital, carbamazepine, valproic acid, lithium, digoxin, cyclosporine, tacrolimus, sirolimus, mycophenolate (for selected populations), theophylline, and methotrexate.

Drugs for which therapeutic drug monitoring has limited value include most beta-lactam antibiotics (wide therapeutic index), most antidepressants (weak correlation between plasma level and response for efficacy, though sometimes useful for adherence or toxicity monitoring), and most antihypertensives (where blood pressure provides a direct pharmacodynamic endpoint superior to plasma drug levels).

Timing of Drug Level Sampling

The timing of blood sampling relative to the dose is as important as the concentration measured. An incorrectly timed sample can produce a result that is uninterpretable or actively misleading.

Trough levels — drawn immediately before the next scheduled dose, after distribution is complete — are the most commonly used sampling strategy. They represent the lowest concentration in the dosing interval and correlate with the minimum sustained exposure the patient experienced. Trough levels for vancomycin, aminoglycosides, and most antiepileptics are drawn at this timing. Peak levels — drawn after distribution is complete (typically 1 hour after an intramuscular or intravenous dose, or 1 to 2 hours after an oral dose for drugs with rapid absorption) — reflect the highest concentration and are used to assess efficacy for concentration-dependent drugs (peak aminoglycoside levels) and to detect peak-related toxicity. Random levels are acceptable only for drugs with long half-lives relative to the dosing interval, where the concentration is relatively stable at any point in the dosing cycle (lithium, digoxin at trough timing, many antiepileptics at steady state).

Two sampling errors that produce misleading results are drawing levels during the distribution phase (falsely elevated — particularly relevant for digoxin, which should be sampled at least 6 to 8 hours after a dose) and drawing levels before steady state is achieved (too early — most drug monitoring is meaningful only after 5 half-lives of maintenance dosing).

Interpreting Levels in Clinical Context

A drug concentration must always be interpreted in the context of the patient's clinical state, not as an isolated number. Three situations where the standard therapeutic range does not apply have already been discussed: phenytoin in hypoalbuminemia (the standard range of 10 to 20 micrograms per milliliter applies to total drug in a patient with normal albumin; in hypoalbuminemia, a lower total level corresponds to adequate free drug), phenytoin in renal failure (same reasoning, with endogenous displacers amplifying the effect), and valproic acid at high concentrations (non-linear protein binding increases the free fraction disproportionately).

Vancomycin monitoring has evolved substantially. Traditional trough monitoring targeted a trough concentration of 10 to 20 micrograms per milliliter, but current guidelines recommend area under the curve-to-minimum inhibitory concentration (AUC/MIC) guided dosing, targeting an AUC/MIC ratio of 400 to 600, because this metric better predicts efficacy against methicillin-resistant Staphylococcus aureus and better correlates with reduced nephrotoxicity than simple trough monitoring. Bayesian dosing programs using initial levels and dosing history can estimate the AUC accurately from one or two measured concentrations.

Therapeutic Drug Monitoring — High-Yield Summary

Sample only after steady state (~5 half-lives of maintenance dosing). Draw trough levels immediately before next dose (after distribution is complete). Draw digoxin levels at least 6–8 hours after dose (distribution phase gives falsely elevated result). Correct phenytoin for albumin in hypoalbuminemia; measure free phenytoin in renal failure. Vancomycin: AUC/MIC-guided dosing now preferred over simple trough monitoring. Lithium, cyclosporine, tacrolimus: use standardized sample timing and send to same laboratory for reproducible trending.


Section 5

Pharmacokinetics in Special Populations

How neonates, elderly patients, pregnant patients, and obese patients differ from the standard adult pharmacokinetic model

The standard adult pharmacokinetic parameters used for drug dosing are derived from healthy adults aged 18 to 65 years at typical body weight. Many patients fall outside this profile in ways that substantially alter drug absorption, distribution, metabolism, and excretion. Understanding the direction and magnitude of these differences allows drug therapy to be rationally adjusted for each population.

Neonates and Pediatric Patients

Neonates present the most extreme pharmacokinetic differences from adults. Cytochrome P450 enzyme expression is dramatically reduced at birth: cytochrome P450 3A4 is present at approximately 30 to 40 percent of adult activity in neonates, cytochrome P450 1A2 is nearly absent, and uridine diphosphate glucuronosyltransferase activity is approximately 25 percent of adult levels. These deficiencies explain the vulnerability to chloramphenicol (gray baby syndrome, as discussed in Module 3) and morphine toxicity. Glomerular filtration rate in neonates is approximately 2 to 4 milliliters per minute per kilogram, reaching adult values (approximately 1.5 milliliters per minute per kilogram, equivalent to the adult 100 to 125 milliliters per minute in a 70-kilogram adult) only by 6 to 12 months of age. Total body water as a fraction of body weight is higher in neonates (approximately 75 to 80 percent) than adults (approximately 60 percent), increasing the volume of distribution for hydrophilic drugs.

Plasma albumin and alpha-1-acid glycoprotein concentrations are lower in neonates, reducing protein binding of both acidic and basic drugs and increasing free fractions. Gastric acid secretion is reduced at birth, raising gastric pH and altering the dissolution and absorption of pH-dependent drugs. The net result is that virtually every pharmacokinetic parameter differs substantially from adults in neonates, and weight-based adult dosing converted to milligrams per kilogram is generally insufficient — neonatal dosing must account for these specific immaturities.

Elderly Patients

Aging produces progressive and predictable changes in pharmacokinetics that make elderly patients significantly more sensitive to many drugs. Renal function declines with age even without overt kidney disease: the average glomerular filtration rate falls by approximately 1 milliliter per minute per year after age 40. Because serum creatinine also falls with age due to decreased muscle mass, the creatinine-based estimation of glomerular filtration rate can be deceptively normal while true filtration capacity is substantially reduced. Renally cleared drugs therefore require dose reduction in elderly patients even when the serum creatinine is apparently normal.

Hepatic blood flow decreases with age, reducing the first-pass metabolism and increasing the oral bioavailability of high-extraction drugs (lidocaine, propranolol, morphine). Phase one cytochrome P450 activity declines modestly with age; phase two glucuronidation is relatively preserved. Body composition changes: lean muscle mass decreases and adipose tissue increases, enlarging the volume of distribution of lipophilic drugs and prolonging their half-lives while reducing the volume of distribution of hydrophilic drugs. Plasma albumin falls modestly, increasing free fractions of albumin-bound drugs. These changes combine to make elderly patients more susceptible to drug accumulation, adverse effects, and drug-drug interactions at doses appropriate for younger adults.

Pregnancy

Pregnancy alters virtually every pharmacokinetic parameter to varying degrees over the three trimesters. Renal blood flow and glomerular filtration rate increase by 40 to 50 percent during pregnancy, substantially increasing the renal clearance of drugs eliminated by filtration. This increase in clearance for renally cleared drugs (including certain antibiotics, lithium, and some antiepileptics) means that pregnancy may require dose increases to maintain therapeutic concentrations. Plasma volume expands by approximately 45 percent, increasing the volume of distribution of hydrophilic drugs and diluting plasma drug concentrations. Plasma albumin falls by approximately 10 to 15 percent, increasing free fractions of albumin-bound drugs. Gastric emptying slows (particularly in the first trimester, associated with nausea), delaying absorption and lowering peak concentrations of orally administered drugs. Cytochrome P450 3A4 and cytochrome P450 2D6 activities increase during pregnancy (due to progesterone-mediated induction), accelerating the clearance of their substrates and potentially requiring dose increases for antiretrovirals, antiepileptics, and other cytochrome P450 3A4 or 2D6 substrates.

Obesity

The pharmacokinetic consequences of obesity are primarily driven by the altered body composition (increased adipose tissue, increased lean body mass relative to a normal-weight person of the same height, expanded blood volume and cardiac output) and by the fact that adipose tissue distributes lipophilic drugs extensively but not hydrophilic drugs. For dosing purposes, the key practical rule — already introduced in Module 2 — is that lipophilic drugs should generally be dosed based on total body weight in obese patients, because adipose tissue contributes to their distribution volume, while hydrophilic drugs should be dosed based on lean or ideal body weight. Specific adjustment factors exist for individual drugs, and drug-specific literature should be consulted for critical medications in severely obese patients.

Parameter Neonates Elderly Pregnancy Obesity
Renal clearance Markedly reduced (immature GFR) Reduced (1 mL/min/year decline) Increased 40–50% Variable; may increase with BMI
Hepatic metabolism Markedly reduced (immature CYPs, UGT) Reduced first-pass (lower hepatic blood flow); CYP modestly reduced CYP3A4, 2D6 increased; some others unchanged Generally increased; higher first-pass for high-extraction drugs
Volume of distribution (hydrophilic) Increased (high body water fraction) Decreased (reduced lean mass, body water) Increased (plasma volume expansion) Little change or slight increase
Volume of distribution (lipophilic) Reduced (less adipose tissue) Increased (more adipose tissue) Increased (expanded adipose and total body water) Markedly increased (adipose accumulation)
Protein binding Reduced (low albumin, alpha-1-acid glycoprotein) Mildly reduced albumin; increased alpha-1-acid glycoprotein in illness Reduced albumin; increases free fraction of acidic drugs Often normal or mildly altered

Section 6

Pharmacokinetic–Pharmacodynamic Relationships

Time-dependent versus concentration-dependent killing, and how drug exposure patterns determine efficacy

Pharmacokinetics describes what the body does to the drug — how concentrations change over time. Pharmacodynamics describes what the drug does to the body — the relationship between drug concentration and effect. For antimicrobials, the integration of these two disciplines provides a rational scientific basis for determining the optimal dose and dosing frequency for each antibiotic class.

Time-Dependent Killing — Beta-Lactam Antibiotics

Beta-lactam antibiotics (penicillins, cephalosporins, carbapenems, monobactams) demonstrate time-dependent bactericidal activity: the rate and extent of bacterial killing is determined primarily by how long the free (unbound) drug concentration remains above the minimum inhibitory concentration for the target organism. Increasing the peak concentration far above the minimum inhibitory concentration does not substantially increase killing; what matters is keeping the concentration above the threshold for as much of the dosing interval as possible.

This pharmacodynamic principle directly informs dosing strategy. For beta-lactams with short half-lives (most penicillins), maintaining adequate concentrations requires either frequent dosing (every 4 to 6 hours) or continuous infusion. Extended-infusion strategies — administering the total dose over 4 to 6 hours rather than as a 30-minute infusion — exploit time-dependent kinetics to extend the period above the minimum inhibitory concentration for organisms with higher minimum inhibitory concentrations, increasing the probability of therapeutic success.

Concentration-Dependent Killing — Aminoglycosides

Aminoglycosides (gentamicin, tobramycin, amikacin) demonstrate concentration-dependent bactericidal activity: the rate of bacterial killing is proportional to the ratio of the peak drug concentration to the minimum inhibitory concentration. Achieving a high peak concentration (typically a peak-to-minimum inhibitory concentration ratio of 8 to 10 or greater) maximizes bactericidal efficacy. Aminoglycosides also exhibit a prolonged post-antibiotic effect — continued suppression of bacterial growth after drug concentrations fall below the minimum inhibitory concentration — which means that the period when concentrations are below the threshold is clinically tolerable.

These pharmacodynamic characteristics provide the scientific basis for once-daily aminoglycoside dosing: administering the total 24-hour dose as a single injection achieves a very high peak concentration (maximizing the peak-to-minimum inhibitory concentration ratio and bactericidal activity) while allowing drug concentrations to fall to nearly zero before the next dose. The drug-free interval allows renal tubular cells to recover from aminoglycoside uptake, reducing the progressive accumulation in the proximal tubule that underlies nephrotoxicity. Multiple clinical trials and meta-analyses support that once-daily dosing is at least as effective as traditional multiple-daily dosing and is associated with less nephrotoxicity in most clinical settings.

AUC-Dependent Killing — Vancomycin and Fluoroquinolones

For vancomycin and fluoroquinolones, efficacy correlates best with the ratio of the 24-hour area under the concentration-time curve to the minimum inhibitory concentration (AUC/MIC ratio). For vancomycin against methicillin-resistant Staphylococcus aureus, current guidelines target an AUC/MIC ratio of 400 to 600 micrograms times hours per milliliter to optimize bactericidal activity while limiting nephrotoxicity. For fluoroquinolones, AUC/MIC targets vary by drug and pathogen but are generally in the range of 25 to 125 for gram-positive organisms and 100 to 250 for gram-negative organisms.

Understanding these three pharmacodynamic patterns has direct implications for how antibiotics should be dosed, and constitutes one of the clearest examples in all of pharmacology where pharmacokinetic-pharmacodynamic principles translate into bedside clinical decision-making. These principles are high-yield for the United States Medical Licensing Examination because they connect mechanism of action, mechanism of toxicity, and rational dosing strategy in a logically unified framework.

Time-Dependent Killing

Time above MIC

  • Drug class: beta-lactams (penicillins, cephalosporins, carbapenems)
  • Key index: % dosing interval with free drug above MIC (>50% optimal)
  • Strategy: frequent dosing or extended infusion
  • Higher peak does NOT increase killing once MIC exceeded

Concentration-Dependent Killing

Peak / MIC ratio

  • Drug class: aminoglycosides, metronidazole, daptomycin
  • Key index: Cmax/MIC (≥8–10 optimal for aminoglycosides)
  • Strategy: once-daily high-dose administration
  • Post-antibiotic effect allows drug-free interval
  • Once-daily dosing reduces nephrotoxicity vs. multiple-daily

AUC-Dependent Killing

AUC/MIC ratio

  • Drug class: vancomycin, fluoroquinolones, azithromycin
  • Key index: AUC⁄MIC (vancomycin target: 400–600 μg·h/mL)
  • Strategy: AUC-guided dosing (Bayesian monitoring for vancomycin)
  • Trough-only monitoring insufficient; AUC/MIC better predicts outcome and toxicity

Section 1

Half-Life, Clearance, and the Fundamental Pharmacokinetic Relationships

The three core parameters that govern drug concentration over time and how they interact

Three pharmacokinetic parameters — clearance, volume of distribution, and half-life — govern virtually all clinically relevant aspects of drug behavior in the body. Understanding how these parameters relate to each other, and how disease states and drug interactions change them, is the foundation for rational dosing in every clinical context.

Clearance

Clearance (CL) is the volume of plasma completely cleared of drug per unit time. It is expressed in units of volume per time (milliliters per minute or liters per hour) and represents the efficiency with which the body removes drug. Clearance is the pharmacokinetic parameter that most directly determines the steady-state plasma concentration for a given maintenance dose: at steady state, the rate of drug input equals the rate of drug removal, so steady-state concentration equals the dose rate divided by clearance. This means that if clearance is halved by renal impairment or enzyme inhibition, the steady-state concentration doubles at the same dose — a proportional relationship that is the pharmacokinetic rationale for dose adjustment when clearance changes.

Total body clearance is the sum of all elimination pathways: hepatic clearance (from metabolism and biliary excretion), renal clearance (filtration plus secretion minus reabsorption), and all minor pathways. For a drug cleared 70 percent by the kidneys and 30 percent by the liver, a 50 percent reduction in renal function reduces total clearance by approximately 35 percent — not 50 percent — because hepatic clearance is unaffected. This proportional thinking is essential for dose adjustment in organ impairment.

Half-Life and Its Dependence on Volume and Clearance

The elimination half-life (t½) is the time required for the plasma drug concentration to fall by 50 percent during the elimination phase. It is not an independent parameter but a derived one: t½ = (0.693 × Vd) / CL. This equation reveals two clinically important facts. First, half-life increases when the volume of distribution increases — a drug that accumulates extensively in tissue has a large reservoir that slowly releases drug back into plasma, prolonging the time to full elimination even if clearance is normal. This is why amiodarone has a half-life measured in weeks despite reasonable hepatic clearance. Second, half-life decreases when clearance increases — a highly efficient eliminating organ reduces the time for each 50 percent decrement in concentration.

The practical rule derived from half-life mathematics is that 97 percent of a drug is eliminated after five half-lives, and 97 percent of the theoretical steady-state concentration is reached after five half-lives of repeated dosing. These five-half-life rules govern washout periods in clinical trials, medication transition timing, and the time clinicians must wait before drug levels become interpretable after initiating or changing therapy.
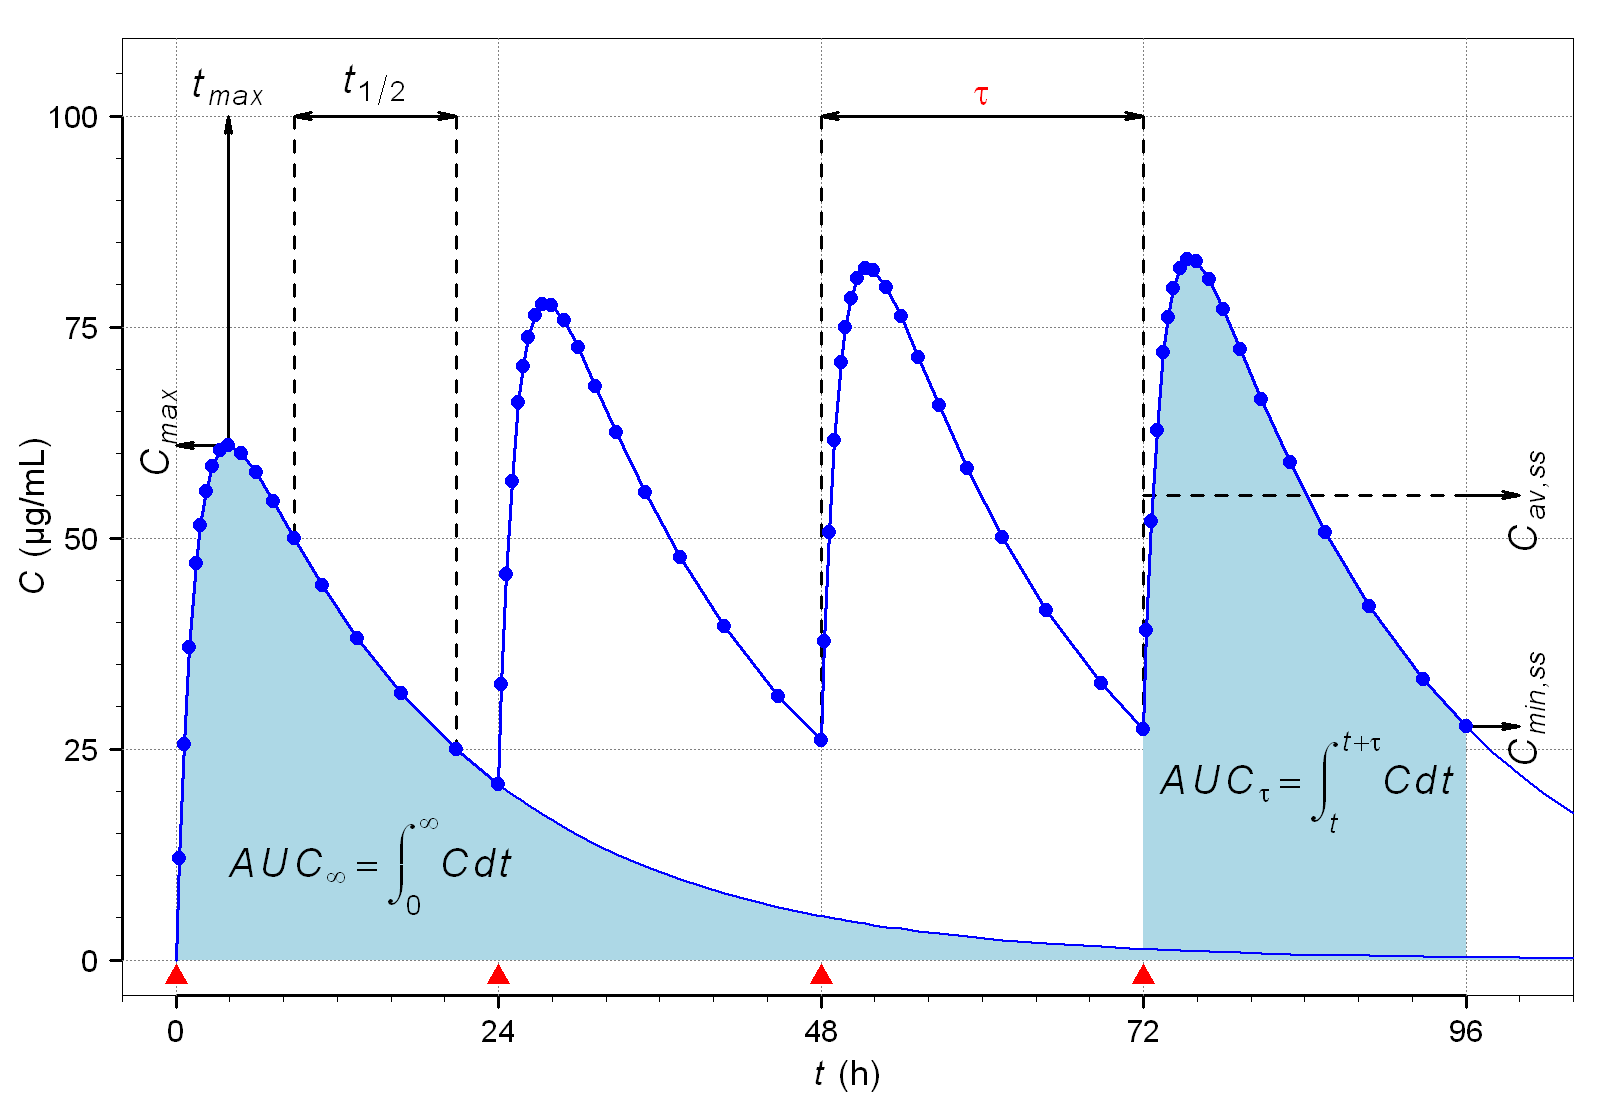
Graph showing plasma drug concentration in micrograms per milliliter over 96 hours following oral administration every 24 hours. The first dose shows Cmax at approximately 63 micrograms per milliliter, Tmax at about 3 hours, and an absorption half-life of 1 hour and elimination half-life of 12 hours. With repeated dosing at 24-hour intervals (tau), drug accumulates until steady state is reached after approximately 60 hours (5 times the 12-hour half-life), at which point peak and trough concentrations stabilize. The shaded areas illustrate AUC infinity after the first dose and AUCτ at steady state, which are equal in linear pharmacokinetics. Cav,ss indicates the average steady-state concentration and Cmin,ss the minimum trough.
Helmut Schütz (Alfie↑↓©). Time course of drug plasma concentrations during repeated oral dosing every 24 hours showing t½, Cmax, Tmax, AUC∞, AUCτ, Cav,ss, and Cmin,ss. Steady state reached at approximately 5 × t½ = 60 hours. Source: Wikimedia Commons. License: CC BY 3.0.
Why Only Clearance Determines Steady-State Concentration

A common misconception is that increasing the volume of distribution raises or lowers the steady-state concentration. It does not. At true steady state, the average plasma concentration depends only on the dose rate and clearance: average steady-state concentration equals dose rate divided by clearance. Volume of distribution affects how long it takes to reach steady state (through its effect on half-life) and how much the concentration fluctuates within each dosing interval, but not the average steady-state level. This distinction matters clinically: two drugs with very different volumes of distribution but identical clearances will reach the same average steady-state concentration at the same dose rate — they just take different amounts of time to get there.

Half-Life Clinical Rules

t½ = (0.693 × Vd) / CL. Five half-lives to 97% steady state or 97% elimination. Steady-state concentration determined by clearance only — not by Vd. Increasing dose increases steady-state concentration proportionally; increasing dosing frequency does not shorten time to steady state. If clearance falls (renal or hepatic disease, enzyme inhibition): steady-state concentration rises proportionally — halve clearance, double steady-state concentration at the same dose.


Section 2

Steady State — Accumulation, Time to Steady State, and Fluctuation

What steady state means, how long it takes to reach it, and how the dosing regimen shapes concentration fluctuation

When a drug is given repeatedly at regular intervals, drug accumulates in the body with each dose because each new dose is administered before the previous dose is fully eliminated. This accumulation continues until the amount eliminated in each dosing interval exactly equals the amount administered — the condition of steady state, at which peak and trough concentrations remain constant from dose to dose.

Time to Steady State

The time to reach steady state is determined entirely by the elimination half-life of the drug: approximately 5 half-lives are required to reach approximately 97 percent of the final steady-state concentration, regardless of the dose, the dosing interval, or the route of administration. This is a mathematical consequence of the exponential accumulation function, not a pharmacological property of the drug. Changing the dose or dosing frequency changes the level at which steady state is eventually achieved but does not change how long it takes to get there.

For drugs with short half-lives, steady state is reached quickly and is clinically irrelevant as a consideration — antibiotics dosed every 6 to 8 hours with a half-life of 1 to 2 hours reach steady state within 8 to 12 hours. For drugs with long half-lives, the time to steady state becomes a meaningful clinical consideration: phenobarbital has a half-life of approximately 4 to 5 days in adults, meaning that steady state is not reached for 20 to 25 days after initiating therapy at maintenance doses. Digoxin has a half-life of approximately 36 to 48 hours in patients with normal renal function, meaning steady state after initiating oral digoxin takes approximately 7 to 10 days.

Loading Doses and Immediate Therapeutic Levels

When the time to reach steady state through accumulation is clinically unacceptable — either because the drug is needed urgently or because the half-life is so long that natural accumulation would take days to weeks — a loading dose is given to rapidly fill the volume of distribution and bring plasma concentrations into the therapeutic range immediately. The loading dose calculation (target concentration multiplied by volume of distribution) was covered in Module 2. The maintenance dose is then begun to maintain that concentration at steady state.

If the loading dose is correct and the maintenance dose is correctly calculated for the patient's clearance, the concentration immediately after the loading dose should approximate the steady-state concentration that the maintenance dose will eventually achieve. If the loading dose is larger than necessary, the concentration will gradually fall toward steady state as elimination exceeds input during the initial phase of maintenance dosing. If the loading dose is too small, the concentration will rise toward steady state from below.

Fluctuation and the Effect of Dosing Interval

At steady state, the concentration rises after each dose (to the steady-state peak, or Cmax,ss) and falls before the next dose (to the steady-state trough, or Cmin,ss, also called Cmin or C-trough). The difference between peak and trough at steady state — the fluctuation — is determined by the ratio of the dosing interval to the half-life. When the dosing interval is much shorter than the half-life (frequent dosing relative to the half-life), little drug is eliminated between doses and the fluctuation is small. When the dosing interval equals one half-life, exactly 50 percent of drug is eliminated between doses, producing moderate fluctuation. When the dosing interval is longer than the half-life, most drug is eliminated between doses and the fluctuation is large.

This is why drugs with narrow therapeutic indexes (where the difference between effective and toxic concentrations is small) are given more frequently: reducing fluctuation keeps both the peak below the toxic threshold and the trough above the minimum effective concentration throughout the dosing interval. Phenytoin, vancomycin, aminoglycosides, and digoxin are examples where both peak and trough concentrations may matter clinically, and dosing interval selection is a deliberate pharmacokinetic decision.


Section 3

Nonlinear Pharmacokinetics

Capacity-saturable elimination, phenytoin as the paradigm, and why small dose changes produce large concentration changes

The pharmacokinetic relationships described so far — including the proportionality between dose and steady-state concentration — assume that elimination processes have unlimited capacity. For most drugs at therapeutic concentrations, this assumption is valid. For a few drugs, however, the eliminating enzymes become saturated at clinically relevant concentrations, and the kinetics change fundamentally.

Michaelis-Menten Kinetics and Saturable Elimination

Enzymes have a maximum rate at which they can process substrate — the maximum velocity (Vmax). At low substrate concentrations, the enzyme is far from saturated and the rate of metabolism is proportional to drug concentration (first-order kinetics: doubling the concentration doubles the rate of elimination). As drug concentration increases toward the enzyme's capacity, the rate of elimination approaches Vmax asymptotically. At very high concentrations, the enzyme is fully saturated and eliminates drug at a constant rate regardless of concentration — zero-order kinetics (a fixed amount of drug eliminated per unit time rather than a fixed fraction).

The clinically important consequence of nonlinear kinetics is that there is no longer a proportional relationship between dose and steady-state concentration. As the dose is increased toward the metabolic capacity ceiling, each additional increment of dose produces a disproportionately larger rise in steady-state concentration. This dose-concentration relationship becomes increasingly steep as saturation is approached, making dosing unpredictable and dangerous.

Phenytoin — The Clinical Paradigm

Phenytoin is the most clinically important drug exhibiting nonlinear pharmacokinetics because it is metabolized by cytochrome P450 2C9 (and to a lesser extent cytochrome P450 2C19), and these enzymes become substantially saturated at phenytoin concentrations within the therapeutic range (10 to 20 micrograms per milliliter). This means that phenytoin operates in a pharmacokinetic danger zone where small dose changes can produce large concentration changes.

A patient whose phenytoin concentration is 12 micrograms per milliliter on a dose of 300 milligrams per day may reach a toxic concentration of 25 micrograms per milliliter when the dose is increased to 350 milligrams per day — a modest-appearing 17 percent dose increase that produces a clinically dangerous concentration because the enzymes are already near saturation. The practical implication is that phenytoin dose adjustments should be made in small increments (25 to 50 milligrams per day rather than large jumps), and adequate time to reach the new steady state must be allowed before the next adjustment. Because phenytoin also has a long half-life (approximately 20 to 60 hours depending on the dose and concentration) and the half-life itself increases as concentration rises due to saturation, reaching steady state can take weeks at higher doses.

Ethanol and aspirin at high doses are two additional drugs that exhibit saturable elimination at clinically relevant concentrations. Ethanol is metabolized at a constant rate by alcohol dehydrogenase (approximately 7 to 10 grams per hour in adults) regardless of blood alcohol concentration — the classic zero-order kinetics — which is why blood alcohol concentration falls linearly rather than exponentially over time after drinking stops. Aspirin at anti-inflammatory doses (greater than 2 to 3 grams per day) saturates the hepatic sulfotransferase pathway and shifts to longer and variable half-lives.

Phenytoin Dosing Cautions from Nonlinear Kinetics

Small dose increases near therapeutic range can produce disproportionate concentration rises — always increase in small increments (25–50 mg/day). Half-life is not constant: it lengthens as concentration rises toward saturation, so time to steady state also lengthens — wait longer before re-checking a level after a dose increase at higher doses. Enzyme inhibitors (fluconazole, amiodarone, valproate) may shift phenytoin from first-order to near-zero-order kinetics at the same dose, causing sudden toxicity. Drug interactions and pharmacogenomic variation in cytochrome P450 2C9/2C19 add further variability.


Section 4

Therapeutic Drug Monitoring

Which drugs benefit from measured levels, when to sample, and how to interpret results

Therapeutic drug monitoring — measuring plasma drug concentrations to guide dosing — is beneficial only for drugs where concentration correlates better with efficacy and toxicity than does dose, where the therapeutic window is narrow enough that concentration differences between patients are clinically consequential, and where concentrations can be measured accurately and affordably. For the relatively small group of drugs meeting these criteria, therapeutic drug monitoring meaningfully reduces both under-treatment and toxicity.

Which Drugs Benefit from Therapeutic Drug Monitoring

The combination of properties that makes a drug a candidate for therapeutic drug monitoring is: narrow therapeutic index (small margin between effective and toxic concentrations), high inter-patient pharmacokinetic variability (so that the same dose produces very different concentrations in different patients), and a demonstrated relationship between plasma concentration and clinical effect or toxicity. Drugs that meet these criteria include aminoglycoside antibiotics (gentamicin, tobramycin, amikacin), vancomycin, digoxin, phenytoin, phenobarbital, carbamazepine, valproic acid, lithium, cyclosporine, tacrolimus, methotrexate, and theophylline.

Not all drugs with narrow therapeutic indexes require routine level monitoring. Warfarin is monitored by its pharmacodynamic effect (the international normalized ratio) rather than by plasma concentration, because the concentration-effect relationship varies too widely among patients. Beta-blockers can be titrated by heart rate and blood pressure. The distinction is that therapeutic drug monitoring is useful when the concentration-response relationship is more consistent than the dose-response relationship.

Timing of Sampling

The timing of the blood sample relative to the dose is as pharmacokinetically important as the concentration result itself. A level drawn at the wrong time is not just uninformative — it can actively mislead clinical decisions.

Trough levels are drawn immediately before the next scheduled dose, when the drug concentration is at its lowest point in the dosing interval. Trough levels are used for drugs where the minimum effective concentration matters — vancomycin trough levels ensure adequate bacterial exposure throughout the dosing interval. Peak levels are drawn at the expected time of maximum concentration after a dose, typically 30 to 60 minutes after the end of an intravenous infusion for most drugs. Aminoglycoside peak levels (used in multiple-daily-dosing regimens) ensure that the peak-to-minimum inhibitory concentration ratio is adequate for bactericidal efficacy.

A critical rule applies to all intravenous drugs exhibiting two-compartment distribution behavior: drug levels must not be drawn during the distribution phase. For digoxin, this means waiting 6 to 8 hours after an intravenous dose before sampling. For lidocaine and many other drugs, peak levels drawn immediately after an intravenous bolus reflect distribution-phase concentrations that are artifactually elevated relative to the eventual equilibrium concentration at the effect site. The same drug level drawn at the right time versus the wrong time can lead to opposite clinical decisions.

Vancomycin monitoring has evolved from simple trough-based monitoring to area under the curve to minimum inhibitory concentration ratio-guided dosing, where the area under the 24-hour concentration-time curve (ideally 400 to 600 milligram-hours per liter for most organisms) predicts both efficacy and nephrotoxicity better than a simple trough. This shift reflects a pharmacokinetically sophisticated understanding that total drug exposure, not just the minimum point in the dosing interval, governs both the therapeutic and toxic effects of vancomycin.

Interpreting Drug Levels in Context

A drug level must always be interpreted in the context of the clinical situation, the timing of the sample, and the patient's protein binding status. A phenytoin level of 8 micrograms per milliliter may represent adequate free drug exposure in a patient with severe hypoalbuminemia, while the same level would represent under-treatment in a patient with normal albumin. A digoxin level of 1.8 nanograms per milliliter may represent toxicity if drawn at 2 hours after the dose but appropriate exposure if drawn at 8 hours. A vancomycin trough of 15 micrograms per milliliter may represent adequate treatment for a sensitive organism but inadequate treatment for an organism with a minimum inhibitory concentration near the upper susceptibility breakpoint.

Therapeutic Drug Monitoring — High-Yield Rules

Draw levels at steady state (5 half-lives after initiation or dose change). Trough: immediately before next dose. Peak: 30–60 minutes after end of intravenous infusion. Never draw levels during distribution phase (digoxin: wait 6–8 hours; most two-compartment drugs: wait for equilibration). Correct phenytoin for albumin in hypoalbuminemia or renal failure. Vancomycin AUC/MIC-guided dosing (target 400–600 mg·h/L) is preferred over trough-only monitoring. Level interpretation requires: timing of sample, patient protein binding status, clinical context.


Section 5

Pharmacokinetics in Special Populations

How neonates, the elderly, pregnant patients, and patients with obesity differ from the standard adult pharmacokinetic model

Standard adult pharmacokinetic parameters were established in healthy adults of typical body composition and organ function. Four populations deviate systematically enough from this baseline that standard dosing frequently requires modification: neonates and infants, elderly patients, pregnant patients, and patients with obesity.

Neonates and Infants

Neonates differ from adults across every pharmacokinetic domain. Their total body water as a proportion of body weight is substantially greater (approximately 75 to 80 percent versus 60 percent in adults), giving hydrophilic drugs a larger volume of distribution per kilogram. Plasma albumin concentrations are lower at birth, increasing the free fraction of highly albumin-bound drugs. Hepatic cytochrome P450 enzyme expression is markedly reduced at birth: cytochrome P450 3A4, cytochrome P450 2C9, and cytochrome P450 2D6 activities are 5 to 30 percent of adult levels at term and mature over the first weeks to months of life. Phase two conjugation pathways are similarly immature: glucuronidation (as demonstrated by chloramphenicol gray baby syndrome) and sulfation capacity are substantially below adult levels at birth. Renal glomerular filtration rate in a term neonate is approximately 20 to 30 percent of the adult rate per unit body surface area, rising to adult values by 6 to 12 months. Together, these factors mean that neonates clear most drugs much more slowly than adults, and that doses must be carefully scaled not only for body weight but for developmental stage.

Elderly Patients

Age-related physiological changes alter pharmacokinetics in predictable directions. Renal function declines with age even in the absence of recognized kidney disease: glomerular filtration rate falls approximately 0.75 to 1 milliliter per minute per year after age 40, so a 75-year-old patient may have a glomerular filtration rate of 50 percent of the young-adult baseline. Because serum creatinine is a product of muscle mass, and elderly patients have reduced muscle mass, the serum creatinine may appear normal despite significantly reduced renal function. Creatinine-based estimates of glomerular filtration rate must account for age and weight to avoid interpreting a falsely normal creatinine as normal renal clearance.

Hepatic blood flow decreases approximately 30 to 40 percent with age, reducing the clearance of high-extraction drugs (morphine, propranolol, lidocaine) that depend on flow-limited delivery to the liver. Body composition changes: fat mass increases as lean mass decreases, increasing the volume of distribution for lipophilic drugs (benzodiazepines accumulate more extensively, producing prolonged sedation). Plasma albumin tends to fall modestly in elderly patients who are ill or malnourished, increasing the free fraction of acidic drugs. The net pharmacokinetic effect in elderly patients is typically reduced clearance and prolonged half-lives, requiring lower maintenance doses and greater attention to accumulation risk.

Pregnancy

Pregnancy produces substantial changes in maternal pharmacokinetics across all four domains of absorption, distribution, metabolism, and elimination. Blood volume increases 40 to 50 percent and total body water increases substantially, enlarging the volume of distribution for most drugs. Renal blood flow and glomerular filtration rate increase 50 to 60 percent above baseline by the third trimester, increasing the renal clearance of drugs eliminated by filtration. Hepatic cytochrome P450 3A4 and cytochrome P450 2D6 activity increases during pregnancy (estrogen and progesterone upregulate expression), while cytochrome P450 1A2 and cytochrome P450 2C19 are modestly inhibited. Gastric emptying slows in the first trimester (increasing the time to peak concentration for oral drugs) and the large uterus elevates abdominal pressure in the third trimester, reducing gastrointestinal absorption reliability.

The practical consequence for drugs requiring therapeutic monitoring in pregnant patients — antiepileptics, antiretrovirals, antibiotics for systemic infections — is that concentrations may fall substantially during pregnancy despite unchanged doses, potentially leading to treatment failure. Monitoring drug levels more frequently and adjusting doses upward during pregnancy is appropriate for these drugs, with post-partum reduction back to pre-pregnancy doses as clearance returns to baseline within weeks of delivery.

Obesity

Obesity creates pharmacokinetic heterogeneity that depends primarily on whether the drug distributes into adipose tissue. As discussed in Module 2, lipophilic drugs have increased volume of distribution in obese patients (more adipose reservoir), while hydrophilic drugs distribute primarily into lean body mass and extracellular fluid, which increases less proportionally with total body weight. The practical dosing rule is to use total body weight for loading doses of lipophilic drugs and lean body weight (or adjusted body weight) for loading doses of hydrophilic drugs.

Renal clearance often increases in obesity due to elevated glomerular filtration rate from hyperfiltration of the enlarged nephron mass, which can increase the elimination of renally cleared drugs and require higher doses than standard weight-based calculations predict. Hepatic clearance may also be modestly increased. The relevant pharmacokinetic issue in obesity is choosing the right weight scalar for the specific drug, rather than applying a single approach to all drug calculations.

Population Clearance Volume of distribution Protein binding Key dosing implication
Neonates Reduced (renal and hepatic immaturity) Increased for hydrophilic drugs (high body water) Reduced albumin; higher free fraction of acidic drugs Lower doses, longer intervals; adjust for developmental stage, not just weight
Elderly Reduced (renal decline; reduced hepatic blood flow) Increased for lipophilic drugs (more fat, less lean mass) Modestly reduced albumin in ill or malnourished patients Lower maintenance doses; creatinine may be normal despite reduced GFR; avoid accumulation
Pregnancy Increased renal clearance; altered hepatic metabolism Increased (expanded blood volume and body water) Modestly reduced (hemodilution) Monitor levels more frequently; doses often need to increase during pregnancy, decrease post-partum
Obesity Increased renal clearance (hyperfiltration); variable hepatic Increased for lipophilic drugs; near-normal for hydrophilic Generally normal Use total body weight for lipophilic drugs; lean body weight for hydrophilic; vancomycin uses total body weight

Section 6

Pharmacokinetic–Pharmacodynamic Relationships

How drug concentration at the target site determines effect, and the three patterns of antimicrobial pharmacodynamics

Pharmacokinetics describes how drug concentrations change over time. Pharmacodynamics describes how a given concentration produces a biological effect. The pharmacokinetic-pharmacodynamic relationship links these two domains and is the foundation for rational dosing strategy, particularly for antimicrobials, where the relationship between concentration and killing determines not only individual patient outcomes but also the likelihood of selecting for resistant organisms.

The Concentration-Effect Relationship

The relationship between drug concentration and pharmacological effect can be described by a sigmoidal curve: at very low concentrations there is no detectable effect; as concentration rises, effect increases steeply; at high concentrations, the maximum effect (Emax) is approached as a plateau. The concentration that produces 50 percent of the maximum effect is called the EC50 and represents the potency of the drug at its target. Most drugs operate at concentrations well below Emax, on the steep portion of the curve where concentration changes translate into meaningful changes in effect. Drugs given at very high concentrations approaching Emax plateau gain little additional therapeutic benefit from further dose increases but continue to accrue toxicity.

Three Patterns of Antimicrobial Pharmacodynamics

Antimicrobials have been systematically classified by the relationship between drug concentration and bactericidal activity, and this classification directly determines optimal dosing strategy. Three patterns have been defined, each with a different pharmacodynamic index (the metric that best predicts microbiological and clinical outcomes).

Time-dependent killing describes drugs whose bactericidal activity is maximized at concentrations just above the minimum inhibitory concentration and does not increase substantially at higher concentrations. For these drugs, what matters for efficacy is how long the free drug concentration exceeds the minimum inhibitory concentration throughout the dosing interval. Beta-lactam antibiotics — penicillins, cephalosporins, carbapenems, monobactams — are the paradigmatic time-dependent killers. The pharmacodynamic target is that free drug concentration should exceed the minimum inhibitory concentration for 40 to 70 percent of the dosing interval (the specific target varies by drug class and organism). The dosing implication is that beta-lactams are better given as more frequent smaller doses or by continuous infusion rather than as large infrequent doses, because this maximizes time above minimum inhibitory concentration without needing excessively high peaks.

Concentration-dependent killing describes drugs whose bactericidal activity increases proportionally with concentration well above the minimum inhibitory concentration, and a higher peak concentration kills more organisms faster. For these drugs, the pharmacodynamic index is the ratio of the maximum (peak) concentration to the minimum inhibitory concentration (Cmax/MIC). Aminoglycosides (gentamicin, tobramycin, amikacin) and fluoroquinolones exhibit concentration-dependent killing. The dosing implication is that once-daily aminoglycoside dosing — which produces a much higher peak concentration than multiple-daily dosing of the same total daily dose — exploits concentration-dependent killing and also allows a drug-free interval that reduces aminoglycoside nephrotoxicity (which correlates with trough exposure duration, not peak).

Area under the curve-to-minimum inhibitory concentration ratio-dependent killing describes drugs where both the duration of exposure and the concentration contribute, so the area under the concentration-time curve is the best predictor of efficacy. Vancomycin and linezolid exhibit this pattern. The now-standard target for vancomycin is an area under the curve over 24 hours to minimum inhibitory concentration ratio of 400 to 600 for serious infections with susceptible organisms, which better predicts clinical success and nephrotoxicity avoidance than simple trough monitoring.

Pattern 1

Time-dependent killing

  • Index: Time above minimum inhibitory concentration (T>MIC)
  • Target: 40–70% of dosing interval above MIC (free drug)
  • Drugs: beta-lactams (penicillins, cephalosporins, carbapenems)
  • Dosing: more frequent doses or continuous infusion

Pattern 2

Concentration-dependent killing

  • Index: Cmax / MIC ratio
  • Target: Cmax/MIC ≥ 8–10 for aminoglycosides
  • Drugs: aminoglycosides, fluoroquinolones
  • Dosing: large infrequent doses to maximize peak
  • Once-daily aminoglycosides exploit this plus reduce nephrotoxicity

Pattern 3

AUC/MIC-dependent killing

  • Index: AUC over 24 hours / MIC ratio
  • Target: AUC/MIC 400–600 for vancomycin
  • Drugs: vancomycin, linezolid
  • Dosing: optimize total daily exposure
  • Vancomycin AUC/MIC monitoring preferred over trough alone

Suggested References
Author / Organization Title Source
Rowland M, Tozer TN Clinical Pharmacokinetics and Pharmacodynamics: Concepts and Applications, 4th ed. Lippincott Williams & Wilkins, 2011
Brunton LL, Hilal-Dandan R, Knollmann BC, eds. Goodman & Gilman’s: The Pharmacological Basis of Therapeutics, 13th ed. McGraw-Hill, 2018
Patsalos PN et al. Antiepileptic drugs: best practice guidelines for therapeutic drug monitoring Epilepsia. 2008;49(7):1239-1276
Rybak MJ et al. Therapeutic monitoring of vancomycin for serious methicillin-resistant Staphylococcus aureus infections Am J Health Syst Pharm. 2020;77(11):835-864
Craig WA Pharmacokinetic/pharmacodynamic parameters: rationale for antibacterial dosing of mice and men Clin Infect Dis. 1998;26(1):1-12
Allegaert K, van den Anker JN Clinical pharmacology in neonates: small individuals, large differences Eur J Clin Pharmacol. 2015;71(9):1029-1035
Koren G et al. Pharmacokinetics of the pregnant woman and fetus Clin Pharmacokinet. 2018;57(6):653-672
Hanley MJ, Abernethy DR, Greenblatt DJ Effect of obesity on the pharmacokinetics of drugs in humans Clin Pharmacokinet. 2010;49(2):71-87